How long could your family keep the house if your income stopped?
Most UK households are closer to the edge than they think. Find your family’s financial runway in under a minute.
If the main earner in your home died tomorrow, the bills would not pause. The mortgage or rent, the energy, the food and the childcare would all still land at the end of the month. The question this index answers is simple: how many months could your household keep paying for everything before the money ran out?
The honest national answer is not long. The Financial Conduct Authority found that almost 1 in 10 UK adults could not cover their living costs for even one week if they lost their main source of household income, and a further 42% could not last more than three months.5 Put those together and around half of UK adults are three months or less from running out.
Check your family’s financial runway
Enter what your household actually spends and what you have to fall back on. The tool shows how many months your savings alone would last after a lost income, and how far a life insurance payout would stretch that runway. Change the numbers and the regional map further down updates to match.
Illustrative only. Real cover need depends on your mortgage, income, dependants and goals, and a real premium depends on your age, health, whether you smoke, the cover amount and the term.
The national picture
Protection cover is the difference between a household that absorbs the shock and one that does not. In 2024 insurers paid out a record £8 billion across life, critical illness and income protection claims, with the average individual claim worth £18,700.2 Yet most homes have nothing in place to call on.
Half of UK adults are three months or less from running out
The family survival map
Where you live changes how fast the money runs out, because housing is the single biggest fixed cost a family carries. The chart and table below rank UK regions and nations by how long a household could keep paying for everything on savings alone, then show how a life insurance payout transforms that runway. They use the figures from the tool above, so they shift as you change them. Choose your region in the tool above and it is highlighted here.
Months a household could cope on savings alone, by region
| Region ▲▼ | Avg rent ▲▼ | Monthly outgoings ▲▼ | Months on savings ▲▼ | With a £200k payout ▲▼ |
|---|
Average rents are the latest ONS Price Index of Private Rents figures for 2026, rounded to the nearest £10.6 The “with a £200k payout” column shows how long the same household could cope if a life policy paid out £200,000, a sum many families set to clear the mortgage and replace income for a period.
Families think cover costs far more than it does
The biggest reason households stay exposed is a simple misunderstanding about price. Research for Legal & General found that UK adults overestimate the cost of life insurance by 184%, guessing around £79.50 a month when the average policy in the study cost £27.95.4 Comparison data puts typical cover lower still, at about £17 a month.9
What people think life cover costs, versus what it costs
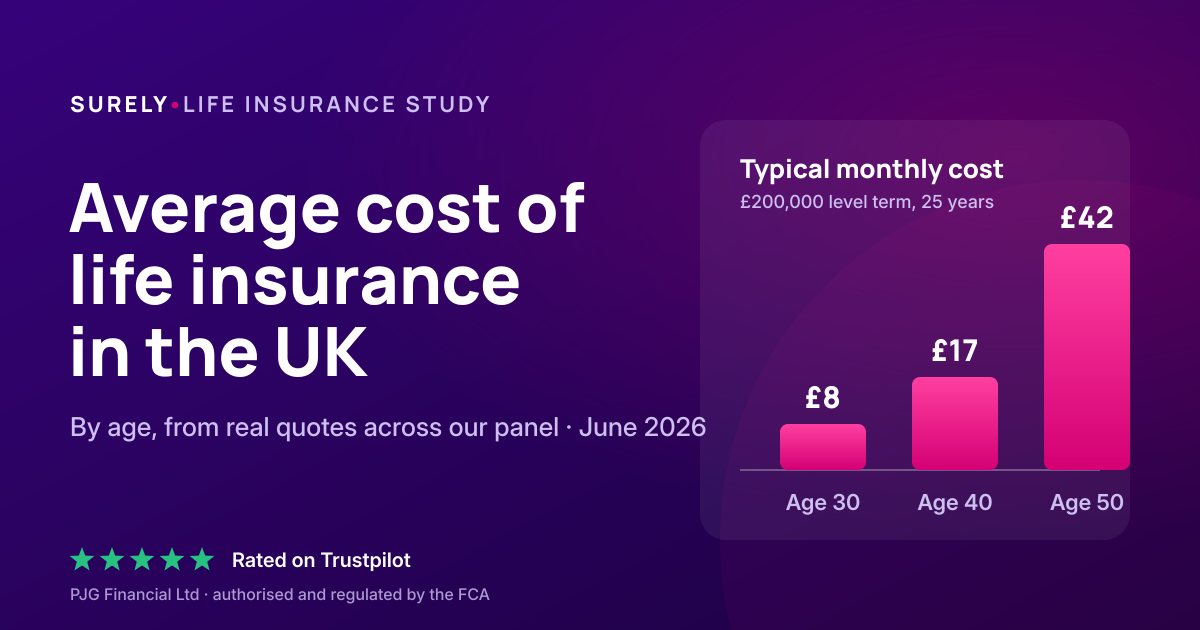
Real prices are lowest when you are young and healthy, which is exactly when families assume they cannot justify the spend. The figures below are typical monthly costs for £150,000 of level term cover over 20 years for someone in good health who does not smoke.10
| Age when you start | Typical monthly cost |
|---|---|
| 30 | £5 to £7 |
| 35 | £8 to £10 |
| 40 | £11 to £14 |
| 45 | £16 to £20 |
| 50 | £27 to £33 |
Your own quote will differ. Price moves with age, health, whether you smoke, the amount of cover and the length of the term. More cover costs proportionately more.

When we model real household budgets, the same pattern shows up everywhere. Families have built a life that depends on one or two incomes, but the safety net behind those incomes is thin. Most are not underinsured because cover is unaffordable. They are underinsured because they have never seen the gap measured against their own outgoings. That is the whole point of this index. Once you can see that your savings cover the house for ten or twelve weeks, and that a payout would buy years instead, the decision tends to make itself.
What this means for your household
The runway in the tool is a snapshot of how exposed you are right now. If it sits below three months, your family is in the same position as roughly half the country, one serious event away from real financial strain on top of everything else.5 Life cover does not change the loss. It changes whether the people left behind also lose the home, the school run and the standard of living they are used to.
A useful way to size cover is to aim for enough to clear the mortgage and replace the lost income for long enough to recover, often several years. The map shows why that matters: on savings alone a typical family copes for two to three months, but a £200,000 payout stretches the same budget into years rather than weeks.
See what cover would cost for your family
Compare quotes from leading UK insurers and find out how much runway you could buy back, often for the price of a streaming subscription or two.
Start your quoteHow we built this
The index turns public data into a single, comparable measure: the number of months a household could keep paying its essential bills after losing its main income.
- Monthly outgoings are the region’s average private rent plus your figure for other essentials. Average rents are the latest ONS Price Index of Private Rents values for 2026, rounded to the nearest £10.6 The default for other essentials, £2,200, is drawn from ONS household spending and typical household bill estimates for a family.7 You can replace both with your own numbers.
- The savings buffer defaults to £10,000, close to the median amount UK adults hold and consistent with the cost of roughly three months of bills for a mortgaged household.8
- Months on savings divides the buffer by monthly outgoings. The payout columns add a life insurance sum to the buffer before dividing, showing how cover extends the runway.
- National resilience figures, including the share of adults who could not last a week or three months, come directly from the FCA Financial Lives survey.5
The model is a planning guide, not a personal forecast. It assumes essentials continue at the same level and does not include any state support, redundancy pay or other household income. Figures are the most recent available at the time of writing.
Sources
- Financial Conduct Authority, “FCA seeks views on how to help close the protection gap”, January 2026. fca.org.uk
- Association of British Insurers and GRiD, “Record £8bn paid out in vital protection claims during 2024”, July 2025. abi.org.uk
- Office for National Statistics, “Families and households in the UK: 2024” and Families overview, 2025. ons.gov.uk
- Legal & General research, reported by MoneyWeek, “Brits overestimate price of life insurance by 184%”, November 2025. moneyweek.com
- Financial Conduct Authority, Financial Lives 2024 survey, financial resilience findings (published 2025). fca.org.uk
- Office for National Statistics, “Private rent and house prices, UK”, 2026 releases. ons.gov.uk
- Office for National Statistics, “Family spending in the UK”, financial year ending 2025. ons.gov.uk
- Raisin UK and Finder UK savings data, 2025 and 2026 (median adult savings about £9,633). theinvestorscentre.co.uk
- Compare the Market average life insurance premium, September 2025 (about £17 a month), reported by MoneyWeek. moneyweek.com
- Broker premium figures for level term cover, LifePro, April 2026. life-pro.co.uk
Buy back your family’s runway
You have seen how many months your savings would last. A few minutes is all it takes to see how many years cover could add, with quotes from leading UK insurers.
Start your quoteSurely is a trading name of PJG Financial Ltd, which is authorised and regulated by the Financial Conduct Authority. FRN 919697.